2024/2025 Budget and Council Tax

Whilst the level of inflation has reduced all Fire and Rescue Services are having to manage the impact of continuing inflation in 2024/25 and uncertainty regarding national pay awards.  As a result, Cleveland Fire Authority faces an increase in costs of £1.521m to maintain existing services.  

The Authority’s Government grant allocation for next year is better than expected.  However, we are still disappointed this increase only covers 30% of the increased cost we face.  As a result funding for Fire and Rescue services continues to shift from Central Government to local taxpayers. We will continue to press the case for a fairer national funding system which recognises the higher fire risks and levels of social deprivation in our area.

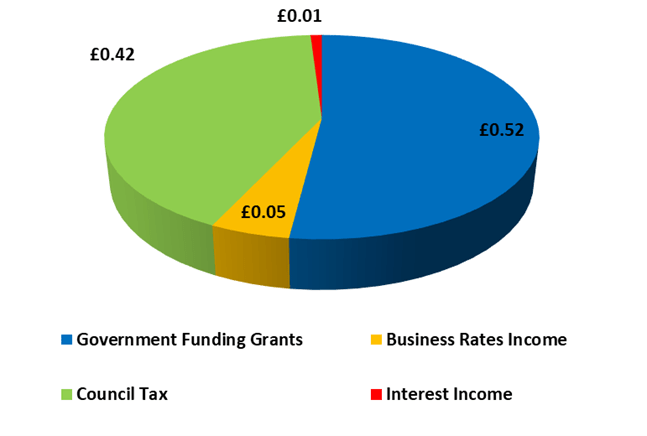
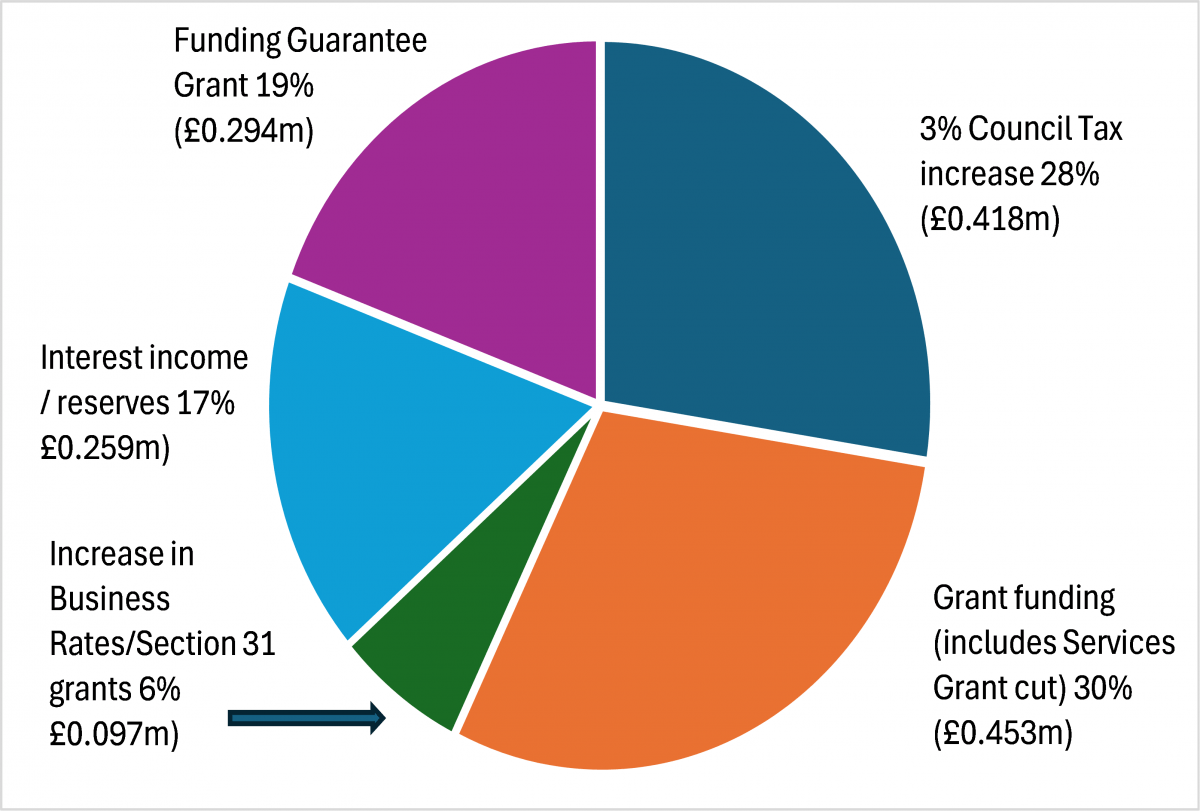
How we have funded increased costs of £1.521m to maintain services

A pie chart showing how we have funded increased costs of £1.521m to maintain services.  A piece of the pie chart is coloured purple and is titled 'Funding Guarantee Grant' This equates to 19% and £0.294 million. Another piece of the pie is coloured teal and is titled 3% Council Tax increase, this equates to 28% of the chart and £0.418 million. Another piece of the pie is coloured orange and is titled Grant funding (includes Services Grant cut) this equates to 30% of the chart and £0.453 million. Another piece of the pie is coloured green and titled 'Increase in Business Rates/Section 31 grants' which equates to 6% of the pie chart and £0.097 million.  Another piece of the pie is blue and titled 'Interest income/reserves' and equates to 17% and £0.259 million.

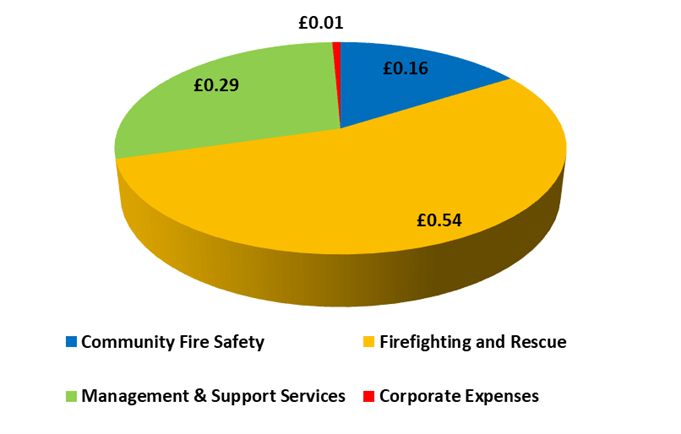
The budget for 2024/25 protects front-line services and avoids cuts in services.

As highlighted in this chart we funded the increase in the cost of existing services from a combination of factors.

Your Council Tax

This table shows the amount payable depending on the banding of your property.

Property

Band
2023/24

(£)
2024/25

(£)
Weekly Costs
2024/25 (£)
Weekly

Increase
% households
A
57.91
59.64
1.15
3p
45.1%
B
67.56
69.58
1.34
4p
18.7%
C
77.21
79.52
1.53
4p
18.3%
D
86.86
89.46
1.72
5p
9.3%
E
106.16
109.34
2.10
6p
5.3%
F
125.46
129.22
2.49
7p
2.1%
G
144.77
149.10
2.87
8p
1.1%
H
173.72
178.92
3.44
10p
0.1%


Where our money comes from and how we spend it

Where each £1 comes from


A pie chart showing where each pound comes from. The largest piece of the chart is blue and shows 52 pence comes from Government Funding Grants. The second largest piece of the pie chart is green and shows forty two pence comes from Council tax. Another piece of the pie chart is yellow and shows that five pence comes from Business Rates Income. The smallest piece of the pie chart is red and shows 1 pence comes from interest income.
 

Where each £1 is spent

A pie chart showing how each pound is spent. The largest piece of the pie is yellow and shows that 54 pence is used towards Firefighting and Rescue. The second largest piece of the pie is green and shows that twenty nine pence is used on Management and Support Services. The third piece of the pie chart is blue and shows sixteen pence is spent on Community Fire Safety. The smallest piece of the pie chart is red and shows that one pence is spent on corporate expenses.
Our Performance

Cleveland Fire Brigade has:

  • one of the fastest response standards in the country to fires in the home,
  • one of the highest rates of home fire safety visits per 1,000 population (37.1); four times more than the national average (9.5)
  • the fifth highest rate of fire safety audits per 100 known premises (5.9); three times the national average (2.0)

    (22/23 Data)

HMICFRS findings 2021/2022 maintains the Brigade’s position as being one of the best performing fire and rescue services in the country.

A blue graphic which shows the word 'GOOD' made up of many pictures of Brigade staff. It reads rated GOOD by HMICFRS. The Brigade's triangular logo is also on the picture as well as the words; Efficiency, effectiveness and people.